

Tippecanoe is a tool for building vector tilesets from large collections of GeoJSON features. Input GeoJSON into Tippecanoe and it will give you back a vector mbtiles file. It is a very efficient way to visualize very large data-sets on an interactive map with minimal impact on performance.
You can see the results of using Tippecanoe in this map of ADS-B pings in and around Los Angeles International Airport. Automatic Dependent Surveillance-Broadcast (ADS-B) is one of the ways that aircraft report their in-flight positions. It is one of the technologies that make aircraft tracking maps like Flightradar24 possible.
I'm not sure how many ADS-B pings the Planes Over LA.2 map is showing but it's definitely enough to be able to clearly make out the flight paths in and out of Los Angeles International Airport.

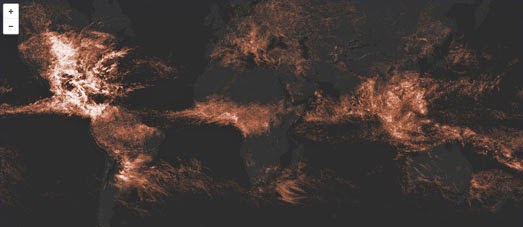
Tippecanoe was originally developed by Eric Fischer at Mapbox to map 6 billion geo-tagged Twitter messages. The 6 Billion Tweets Map is a great visualization of Twitter's global appeal, showing where Twitter is popular and also where in the world the social network has yet to gain traction.
The Tippecanoe tool was also used by Mapbox to create the Superpowered 1.5 Million Walks, Runs, and Bike Rides map. This map overlays Runkeeper routes on top of a Mapbox powered map of the world.
The map includes some quick links to jump to the maps of a few major cities around the world and you can also pan and zoom the map to view the popular running routes at any location in the world. If you zoom in on the map you can view the recorded tracks right down to sidewalk level.
Tippecanoe was also used to help create A Month of Lightning, an interactive map of all 80,305,421 lightning strikes that occurred across the globe in May 2013.
Jordan Rousseau was able to use Tippecanoe to process the May 2013 lightning data from Weather Decision Technologies. The result is this impressive Mapbox map which allows you to view over 80 million global lightning strikes from just one month. You can read more about how the map was made in Jordan's blog post, Visualizing a Month of Lightning.
No comments:
Post a Comment