
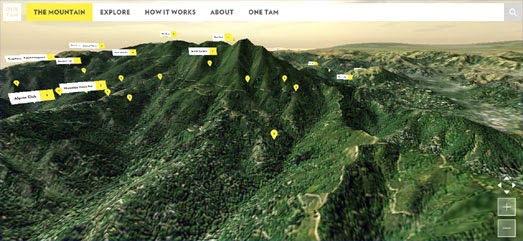
Our Tam is an amazing WebGL powered 3d map of Mount Tamalpais in Marin County, California. Using the map you can rotate around the mountain and zoom in and out on features with incredible speed. If you view the site in a non-WebGL browser the map degrades gracefully to a 2d Google Map.
The map features a number of markers which allow you to explore stories, photos and videos of the mountain left by other users. You can add your own stories, photos or videos about Mount Tamalpais by clicking on the map and selecting the 'Leave s Story' button.
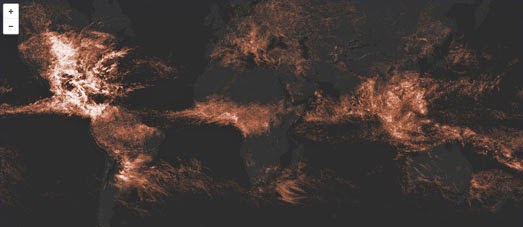
A Month of Lightning is an interactive map of all 80,305,421 lightning strikes that occurred across the globe in May 2013.
Mapping 80 million data points on a digital map is not an easy task. However when Mapbox's Eric Fischer created the Most Detailed Tweet Map Ever he also built & released an open sourced tool called Tippecanoe for making vector tiles from large data sets.
Jordan Rousseau was able to use Tippecanoe to process the May 2013 lightning data from Weather Decision Technologies. The result is this impressive Mapbox map which allows you to view over 80 million global lightning strikes from just one month. You can read more about how the map was made in Jordan's blog post, Visualizing a Month of Lightning.

There are many ways to decorate your house on Street View. By far the most beautiful is Sakura.
Sakura allows you to visualize how your house would look if you could transport it to Japan in the springtime, just at the moment when the cherry blossom is in full bloom. If you have a WebGL capable browser you can share your location with Sakura and see a Street View of your own home covered in pink cherry blossom.
If you're a fan of Street View then you should also have a look at Teleporter, a fun application which will transport you to random locations around the world on Google Maps Street View.

This week I was also very impressed with two map tools. Street Patterns
is an ingenious tool for creating SVG images from OpenStreetMap data.
In truth Street Patterns is actually a very detailed tutorial about how
you can use Overpass and Turf
to develop your own SVG map graphics. However the tutorial includes a
number of map wizards which automate every stage of the process.
Turf,jsParty consists of two main sections, an editor and a Leaflet map. The editor allows you to choose from a number of common turf operations. You can edit and play around with the examples in the editor and view your edits directly on the Leaflet map. Of course you don't have to use the provided examples and can test your own turf operations by entering them directly into the editor.
No comments:
Post a Comment