
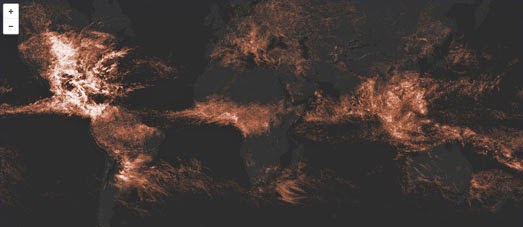
A Month of Lightning is an interactive map of all 80,305,421 lightning strikes that occurred across the globe in May 2013.
Mapping 80 million data points on a digital map is not an easy task. However when Mapbox's Eric Fischer created the Most Detailed Tweet Map Ever he also built & released an open sourced tool called Tippercanoe for making vector tiles from large data sets.
Jordan Rousseau was able to use Tippercanoe to process the May 2013 lightning data from Weather Decision Technologies. The result is this impressive Mapbox map which allows you to view over 80 million global lightning strikes from just one month.
You can read more about how the map was made in Jordan's blog post, Visualizing a Month of Lightning.

If you want to see where lightning is striking right now then you can also check out these two real-time lightning maps.
LighteningMaps is a live Google Map of lightning strikes across the globe. Animated flashing circles light-up on the map to record each lightning strike so it is easy to see where in the world electrical storms are occurring right now.

Blitzortung.org works with a community of users, who have built their own lightning receivers, to automatically display live lightning data on a Google Map.
Blitzortung.org includes instructions on how you can build your own lightning monitor and also includes instructions on how you can build your own Google Map based on the data received from a lightning monitor.
If you can't be bothered to build your own lightning box you can always just check out Blitzortung's live Google Map of lightning strikes.
No comments:
Post a Comment